The math behind content marketing has quietly broken. Enterprise teams spend a median of $12.8M annually on content production (Content Marketing Institute, Enterprise Content Marketing 2025) while 48% flag content repurposing as their primary scaling failure. Organizations publish more than ever and extract value from a shrinking percentage of it. The 20-asset model treats this as a manufacturing problem, not a publishing one. SAP’s “Digital Chop Shop” program, which atomized one whitepaper into 650 pieces across 25 verticals to generate $23M in pipeline (Stratabeat case documentation), shows the upper bound. Most teams will not reach 650; they will, however, not survive at one. This briefing maps the mechanics of converting one idea into twenty traffic assets, with format yield data and the operational fault lines that surface fast.
The Economics of Single-Use Content
Three figures explain the shift. Content grouped into clusters drives 30% to 43% more organic traffic than unconnected pieces and holds rankings about 2.5 times longer (HubSpot research; HireGrowth 2025 cluster analysis). Pages inside a topic cluster pick up 63% more keyword rankings within 90 days, because Google’s relevance graph treats them as mutually reinforcing entities. After Google’s December 2025 core update, sites running thin or mass-produced content saw traffic compressions of 85% to 95%, while interconnected cluster sites with original data saw measurable lift (Whitehat SEO, 2026 review).
Single-asset publishing has stopped being neutral. It is now a slow drawdown.
Atomization changes the unit economics. Repurposing improves content ROI by approximately 32% on average, and the figure compounds because format-platform pairs occupy non-overlapping audiences. A LinkedIn document post does not cannibalize a podcast episode. They are separate harvests on separate algorithms. Buyer behavior reinforces the model: 67% of B2B buyers consume at least five pieces of content before engaging a sales rep (HubSpot State of Marketing 2026). One asset cannot fulfill that journey. Twenty distributed across funnel stages and channels can.
The Pillar Test: What Qualifies an Idea for 20-Way Atomization
Not every idea sustains twenty derivatives. A reliable filter has three components: extractable depth, format elasticity, and cross-funnel relevance. An idea fails if it cannot survive segmentation into at least eight self-contained sub-claims, depends on a single visual or narrative format, or speaks to only one audience tier.
Strong pillar candidates contain original data, a defensible framework, or a contrarian position. They include numerical or comparative content that converts cleanly to charts and carousels, and they address questions that recur across awareness, consideration, and decision stages. Process-driven topics, benchmark studies, named frameworks, and proprietary research consistently pass. Opinion pieces, news commentary, and product-feature posts consistently fail. The matrix below is the working evaluation rubric. Anything scoring under 12 should not enter the atomization pipeline.
| Evaluation Dimension | Weak Pillar (1 pt) | Adequate (2 pts) | Strong Pillar (3 pts) |
|---|---|---|---|
| Extractable sub-claims | Fewer than 4 distinct points | 5 to 8 sub-claims | 9+ self-contained insights |
| Original data or research | Cites third-party data only | Mixes secondary with team analysis | Original survey, benchmark, model |
| Visual conversion potential | Predominantly narrative prose | Some structured comparisons | Native charts, frameworks, matrices |
| Funnel coverage | Single funnel stage | Two stages addressed | Awareness, consideration, decision |
| Format elasticity | Survives only as long-form text | Adapts to two or three formats | Written, visual, video, audio |
| Search demand depth | Single head term, low cluster | Moderate cluster of related queries | Pillar plus 15+ supporting queries |
A score of 15 or higher signals an asset worth atomizing aggressively. A score of 12 to 14 supports a partial fragmentation, perhaps 8 to 10 derivatives. Anything below 12 should be published as a single piece, because forcing atomization on a thin idea costs more than it returns.
The 20-Asset Architecture: A Six-Layer Framework
A workable plan does not list 20 random formats. It distributes them across discovery surfaces with distinct algorithmic logics, so each asset captures traffic the others cannot.
Layer 1: Search Foundation (Assets 1 to 4)
The pillar page (Asset 1) is the source document, requiring 3,000 to 5,000 words to compete in 2026. Asset 2 is an executive summary, 600 to 900 words optimized for quick-reference SERP intent. Assets 3 and 4 are cluster posts going deep on individual sub-claims, internally linked back. Cluster pages added in the same publishing window rank 60% to 65% faster than orphan posts.
Layer 2: Long-Tail Capture (Assets 5 to 7)
Asset 5 is a structured FAQ post optimized for featured snippets. Asset 6 is a comparison post built around versus-style queries. Asset 7 is a glossary or definition page. Clusters that include glossary entries see 3.2x more AI citations in ChatGPT, Perplexity, and Google AI Overviews (HubSpot analysis).
Layer 3: Social-Native Atoms (Assets 8 to 12)
This is where most teams get unit economics right but channel logic wrong. Publishing identical content across LinkedIn, X, and Instagram triggers algorithmic throttling on each. Asset 8 is a LinkedIn document carousel, the highest-performing organic format on the platform at 6.60% average engagement (Socialinsider, n=1.3M posts) versus 0.5% to 2% for text-only posts. Asset 9 is a long-form personal-account analysis post; employee posts produce 2x corporate-page engagement and reshare 561% further (LinkedIn, 2025). Asset 10 is an X thread built around the most contrarian claim. Asset 11 is an Instagram carousel rebuilt natively. Asset 12 is a Reddit or Quora answer written as substantive contribution rather than promotional copy.
Layer 4: Video and Audio Derivatives (Assets 13 to 16)
Asset 13 is an 8 to 12 minute YouTube long-form video, delivering 60% to 70% retention with 5% to 12% CTR (upGrowth, 2026). Asset 14 is three to five Shorts, Reels, or TikToks clipped from the long-form recording. Channels using both grow 41% faster, because Shorts produce discovery while long-form produces conversion. Asset 15 is a podcast episode. Asset 16 is a set of 30 to 90 second audiograms. One production session yields four content surfaces.
Layer 5: Owned-Audience Activation (Assets 17 and 18)
Asset 17 is the email newsletter feature making the pillar the primary editorial of the next send. Email content marketing remains the highest-ROI channel at $36 to $42 per dollar spent (Litmus, Firework). Asset 18 is a multi-touch drip sequence of three to five emails. Owned audiences bypass the algorithmic discount throttling organic social reach.
Layer 6: Conversion-Layer Assets (Assets 19 and 20)
Asset 19 is a gated PDF with original data not in the public version. Asset 20 is a webinar with a guest expert. Live LinkedIn events generate roughly 24x higher engagement than static posts and produce a recording that becomes a downstream asset for the next quarter.
The full architecture is summarized in the matrix below.
| Layer | Assets | Primary Function | Time-to-Value | Compounding |
|---|---|---|---|---|
| 1. Search Foundation | 1 to 4 | Topical authority, organic | 90 to 180 days | High; ranks improve 12 mo |
| 2. Long-Tail Capture | 5 to 7 | SERP and AI citation | 60 to 120 days | High; AI surface growing |
| 3. Social-Native Atoms | 8 to 12 | Reach and engagement | 24 to 72 hours | Low individually, high agg. |
| 4. Video and Audio | 13 to 16 | Discovery and trust | 30 to 90 days | Medium; YouTube compounds |
| 5. Owned-Audience | 17, 18 | Conversion and nurture | 7 to 30 days | High; list grows durably |
| 6. Conversion Assets | 19, 20 | Lead capture, pipeline | 14 to 60 days | Medium; recyclable |
Yield Benchmarks: Why Format Choice Determines 80% of Outcome
The single biggest predictor of atomization success is not effort. It is format-platform fit. Two pieces of identical content can produce a 10x engagement difference based on whether the team picked the right wrapper for the right surface.
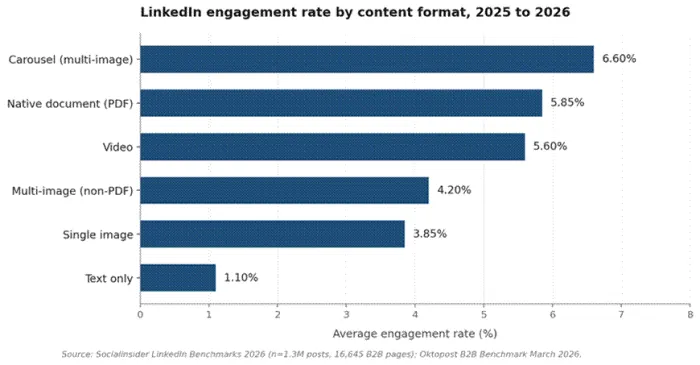
Figure 1. Format-level engagement gap on LinkedIn, 2025 to 2026.
The gap is not subtle. Document posts produce roughly 596% more engagement than text-only posts and 278% more than video on LinkedIn (Socialinsider, 2025-2026). The mechanism is dwell time: a carousel forces users to swipe, signaling quality consumption to the ranking algorithm, which expands distribution. Adding an external link to a LinkedIn original post causes a 25% to 35% reach drop (Just Connecting, 2024-2025), which is why experienced operators publish carousels native and move links to the first comment.
Format yield differences across platforms are summarized below.
| Platform | Highest-Yield Format | Engagement Lift | Algorithmic Driver |
|---|---|---|---|
| Document carousel (PDF) | 4x to 6x over text | Dwell time, swipe completion | |
| X (Twitter) | Long-form thread | 2.5x to 4x over single tweet | Reply velocity, bookmarks |
| Carousel (image-native) | 1.4x to 2x over single image | Saves, time on post | |
| YouTube | 8 to 12 min long-form | Higher LTV; Shorts higher reach | Watch time, satisfaction |
| TikTok / Reels / Shorts | 15 to 30 sec hook video | 10x reach of long-form | Completion rate, replays |
| Personalized segmented | 60% lift over generic | Inbox engagement, CTR |
The implication is direct: do not publish the pillar everywhere. Match each derivative to the format the destination platform actually rewards. A whitepaper PDF as a LinkedIn document post will outperform a polished blog excerpt by an order of magnitude.
SECTION 05
The 30-Day Atomization Calendar
Atomization fails most often at sequencing rather than ideation. Teams produce all twenty assets and dump them in three days, which crowds the audience and burns algorithmic patience across every channel. A 30-day cadence keeps the surfaces oxygenated.
Days 1 to 5 (Foundation): Pillar (Asset 1) ships with internal links complete at first index. Email newsletter (17) goes to the warm list on Day 3 or 4. Cluster posts (3, 4) publish on Days 4 and 5.
Days 6 to 12 (Cluster expansion): Executive summary (2), FAQ (5), comparison (6), and glossary (7) publish one per day, reaching the bidirectional link density Google needs to recognize the cluster as a unit.
Days 13 to 20 (Cross-platform): LinkedIn carousel (8), thread (10), and analyst long-post (9) ship on alternating days, 48 hours apart same-platform. YouTube long-form (13) launches mid-week. Instagram (11) and Reddit/Quora (12) close the social phase.
Days 21 to 30 (Audio, video, conversion): Podcast (15) drops with audiograms (16). Shorts (14) stagger every 48 hours. Drip sequence (18) launches mid-window. Gated PDF (19) and webinar (20) close the cycle, feeding the email list for the next pillar.
Operational Tool Stack
Tool choice matters less than workflow discipline, but the wrong stack produces friction that quietly kills programs. The mature stack has three tiers: planning (Notion, Airtable, Asana), transformation (Descript, Opus Clip, Lately.ai, Canva), and distribution and measurement (Buffer, Oktopost, GA4, Search Console, Ahrefs).
| Tier | Function | Representative Tools | Common Failure Point |
|---|---|---|---|
| Planning and orchestration | Mapping derivatives to channels | Notion, Airtable, Asana, Monday | Untracked dependencies |
| Transformation | Extraction, clipping, formatting | Descript, Opus Clip, Lately, Canva | Quality drift; over-automation |
| Distribution and measurement | Scheduling, advocacy, analytics | Buffer, Oktopost, GA4, GSC | Attribution gaps; vanity metrics |
The temptation in 2026’s AI-saturated tooling market is to add another tool every quarter. Resist it. Programs that survive past month six tend to use fewer tools, more deeply, with documented playbooks. Tool sprawl correlates inversely with execution quality.
Where Atomization Breaks: Failure Modes
Most atomization programs fail at predictable operational fault lines. The most common, in approximate order of frequency:
•Format laziness. Teams paste the same excerpt across LinkedIn, X, and Instagram with minor edits. Each algorithm identifies the redundancy and throttles distribution.
•Premature gating. The PDF launches before Layers 1 to 4 produce warm traffic. Empty form fields create the false conclusion that gated content does not work.
•Pillar thinness. The source scores below 12 on the pillar test but enters the pipeline anyway. Twenty derivatives from a thin pillar produce twenty thin assets.
•Sequencing collapse. All twenty assets ship in five days. Audience fatigue depresses engagement below platform medians.
•Attribution blindness. The team measures only first-touch on the pillar URL and concludes 80% of derivatives did not work. Multi-touch attribution is foundational, not optional.
•Tool sprawl. New AI tools added every quarter, none retired. By month nine the workflow is a brittle integration chain no one can debug.
Each failure mode is correctable in principle and stubborn in practice. Programs that document their atomization process in a written playbook, refreshed quarterly, recover roughly twice as fast as those operating on tribal knowledge.
Decision Framework: When the 20-Asset Model is Wrong
The 20-asset architecture is not universal. It assumes a substantive idea, production capacity to execute without quality drift, and analytical infrastructure to measure across surfaces. Teams missing any one should narrow scope rather than fake volume.
Solo operators and lean startups should target the 6-to-8 asset version: pillar, two cluster posts, LinkedIn carousel, X thread, email feature, podcast or video, and gated PDF. The compounding logic still holds at smaller scale. This shift toward smaller but more reusable content systems is also why AI-focused publishing platforms such as WriteNexa are increasingly emphasizing structured content workflows over one-off article generation. Enterprise teams running multi-product portfolios should atomize selectively, prioritizing pillars tied to highest-revenue product lines rather than maintaining uniform 20-asset cadence across every category.
Twenty assets from one idea is a leverage statement. One asset from one idea is a tax.